
While surfing the internet looking for discussion of the FSI rankings I found that much more attention is given to the rank of States on the index rather than their score. This is unfortunate because the real power in the failed states index is the in-depth analysis and score. It's also a great way to examine the overall direction of a State. These are not arbitrary numbers assigned to each category based on minimal research. Each category for each State is researched as extensively as possible. As such, the score is much more important than the rank.
I took scores from the 2006 Failed States Index and 2010 Failed States Index to look at the change over that 4 year period. While the index dates back to 2005, the scores were not as extensive and a lot of data was unavailable. The 2006 data (and select data from 2007) provides a much better point of comparison to the 2010 data. Realisitcally, four years isn't enough time to fairly evaluate an administration or regime with this deep an analysis. Fixing a failed state takes time. Still, examining the failed states index over even a short period of time provides insight into a country and even the state of the world.
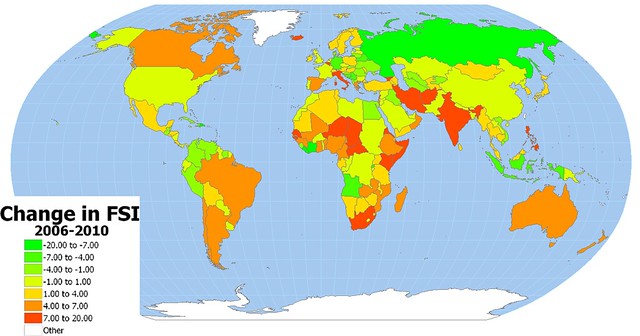
Below is the map I made showing the change in score from 2006 to 2010. Note that the negative values reflect a better score, this is to say green represents those States which have improved the most while red shows those who are moving away from order.
If you're interested I've made the KML file available here.
I've listed 161 States in rank order of FSI score change from 2006 to 2010. South Africa has had the greatest change in the wrong direction from 55.7 in 2006 to 67.9 in 2010. The last, Montenegro improved its score from 83.8 in 2006 to 57.3 in 2010 however it should be noted that the 2006 ranking is for both Serbia and Montenegro. The FSI score of Serbia improved to 77.8 in 2010.
1 South Africa
2 Kenya
3 Guinea-Bissau
4 Niger
5 Italy
6 Lebanon
7 Afghanistan
8 Eritrea
9 Central African Republic
10 India
11 Iceland
12 Senegal
13 Somalia
14 Iran
15 Georgia
16 Belgium
17 Philippines
18 Chad
19 Cameroon
20 Mozambique
21 Ethiopia
22 Ghana
23 Gambia
24 Spain
25 Madagascar
26 Guinea
27 Chile
28 Benin
29 Nigeria
30 Australia
31 Israel
32 Argentina
33 Oman
34 Greece
35 Canada
36 Mali
37 Equatorial Guinea
38 New Zealand
39 Zambia
40 Brazil
41 Singapore
42 Thailand
43 Malawi
44 Namibia
45 Ireland
46 Cambodia
47 Algeria
48 Yemen
49 Hungary
50 Japan
51 Sri Lanka
52 Honduras
53 Malaysia
54 Switzerland
55 Uganda
56 Mexico
57 Burma
58 Tanzania
59 Sweden
60 Turkey
61 Armenia
62 Azerbaijan
63 Mauritius
64 Costa Rica
65 Tunisia
66 Bolivia
67 El Salvador
68 Norway
69 Bahrain
70 Gabon
71 Mongolia
72 Botswana
73 Djibouti
74 Tajikistan
75 Swaziland
76 South Korea
77 Zimbabwe
78 Mauritania
79 Moldova
80 Poland
81 Finland
82 Austria
83 Burkina Faso
84 Lesotho
85 Laos
86 Kazakhstan
87 United Arab Emirates
88 United States
89 Kuwait
90 Jamaica
91 France
92 Libya
93 North Korea
94 China
95 Ecuador
96 Morocco
97 Portugal
98 Saudi Arabia
99 Nicaragua
100 Paraguay
101 Uruguay
102 Burundi
103 Nepal
104 Jordan
105 Congo (Kinshasa)
106 Bangladesh
107 Togo
108 Netherlands
109 Guyana
110 Estonia
111 Malta
112 Czech Republic
113 Panama
114 United Kingdom
115 Sudan
116 Congo (Brazzaville)
117 Pakistan
118 Bhutan
119 Syria
120 Papua New Guinea
121 Slovenia
122 Luxembourg
123 Latvia
124 Bulgaria
125 Belize
126 Slovakia
127 Suriname
128 Albania
129 Iraq
130 Qatar
131 Kyrgyzstan
132 Denmark
133 Egypt
134 Lithuania
135 Vietnam
136 Peru
137 Macedonia
138 Romania
139 Cuba
140 Venezuela
141 Cyprus
142 Croatia
143 Haiti
144 Sierra Leone
145 Guatemala
146 Ukraine
147 Colombia
148 Turkmenistan
149 Uzbekistan
150 Rwanda
151 Germany
152 Angola
153 Bosnia and Herzegovina
154 Belarus
155 Serbia and Montenegro
156 Indonesia
157 Liberia
158 Côte d'Ivoire
159 Russia
160 Dominican Republic
161 Montenegro


This comment has been removed by the author.
ReplyDeleteLooks like it's the week for these types of articles; the Map Scroll has an article on the Global Peace Index this week at http://mapscroll.blogspot.com/2010/09/global-peace-index-2010.html. I have a (somewhat) related article at the Basement Geographer lined up for tomorrow on another enigmatic national indicator: gross national happiness. Synergy!
ReplyDeleteOuch for Canada. While on the overall index we do quite well (166 out of 177), it's quite shocking to see the drop over time. I have my theories but I'll keep my mouth shut!
It's interesting to see that italy has done worse than Afghanistan. On the otehr hand, Greece and Iceland with the banking issues, did not "worsen" as much.
ReplyDeleteI wonder what are the reasons behind that.
It's all relative when it comes to this "analysis". It's important to remember that Italy, is in far better shape than Afghanistan and by no stretch could it be considered "failed". Greece and Iceland on the other hand, I imagine we'll see them drop in the 2011 index because of what we're hearing in the news today.
ReplyDeleteyou swapped india with pakistan. Kindly check.
ReplyDeleteAn understudy today in Go begins with a position of 30 Kyu, the most minimal position conceivable, and works up to the position of first Kyu,blog comment service
ReplyDelete