I imagined that most of Africa looked like this:

I was certain all of Russia looked like this:

I was confident Brazil looked like this:

I was confident Brazil looked like this:

Although I think that was because of the song my dad sang "Way down among Brazilians Coffee beans grow by the billions". Interestingly enough, I thought the word was "Brazilia". There was also a time where I thought the word was "Vermilion", as in, Ohio.
And due to a presentation in 4th grade, I learned that China, for the most part, looked like this:

This was my "Window on the World" version 0.5
Version 1.0 of the Window on the World, Google Earth, wouldn't come for another 15 years.
I must give credit where credit is due. My dad was the one who coined (at least in my mind) the Window on the World concept. He first mentioned it in this 15 year gap. The original idea was live video feeds from all over the world which could be viewed like channels. While it has been implemented in several ways, I can't think of a good, inclusive site, app or anything that does what he described.
I must give credit where credit is due. My dad was the one who coined (at least in my mind) the Window on the World concept. He first mentioned it in this 15 year gap. The original idea was live video feeds from all over the world which could be viewed like channels. While it has been implemented in several ways, I can't think of a good, inclusive site, app or anything that does what he described.
Google Earth was so great because it made it possible to actually see these places, through a shiny new digital lens. Perhaps not the Window on the World my dad described but something that allowed me to replace my imaginary or outdated images with real imagery. With the addition of the Control+alt+a flight simulator, I could fly anywhere in the world in an SR22 prop place. That would be version 1.0.1
Street view brought us up to Window on the World version 2.0. Truth be told, what pushed me over the early-adopter-versus-buyers-remorse teeter-totter on the iPad was the ability to zoom around the street view images of far away lands (read select European cities). Straight out of the ad to my local apple store, I'm pretty sure the first place I looked at was the Eiffel Tower - that doesn't make sense for me though, I must have seen the commercial too many times. It's a good thing the iPad 2 commercials don't include some minor advancement in streetview functionality or I probably would have been waiting in line on March 11th. My reality is becoming Apple commercials. Also of note, I've looked up Apple's stock symbol (AAPL) so many times that it takes me a couple seconds to remember how to actually spell apple...the Newtonian spelling.
With the iPad (version 1.0 for those who pay attention to such trivial things), I'm left with a good streetview portal that forces me to put up with this screen more often than I'd like.
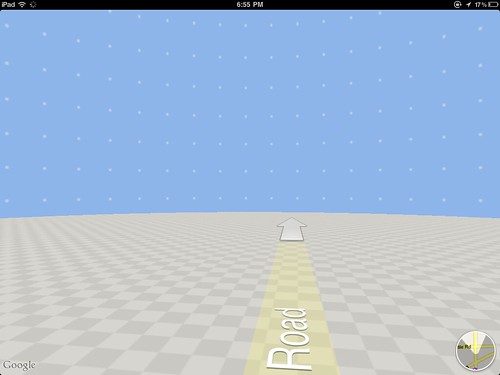
For any iPad Google map users out there, you probably find the above image hilarious, and you should. For those that don't, well, go get an iPad...or an iPad2.
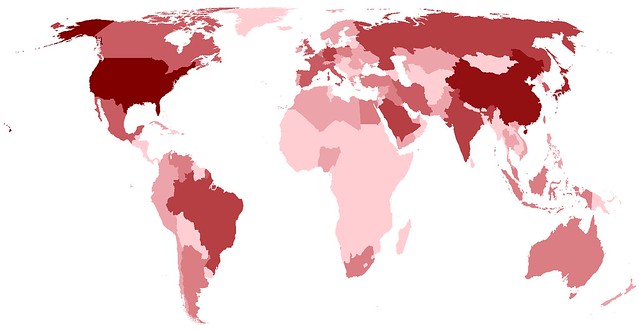
The version upgrade to 2.0 made the earth more accessible than every before...well, half of it (the map below shows the coverage area). That is still an issue (another being that I told myself I wouldn't use parenthetical humor or sarcasm more than twice in this post). Perhaps this is more like Window on the World 2.0 beta. Or version 1.9, the one that everyone is scared to download to their phone.

That brings us to the topic of today's post, something you've probably been wondering about since you started reading! After feeling guilty (guilty isn't the right word but I can't think of anything better) about my mildly scathing review of National Geographic's World Atlas update, I think it's important I throw out an iPad app for you to enjoy, or at least one you can enjoy vicariously through your techy counterparts.
What this app can do dwarfs the fact that it is one of the most unintuitive things I've used on the iPad. That, of course, can be remedied through practice. I'm willing to take time and learn with an app that truly merges photography and geography. A few more minutes went a long way this evening.
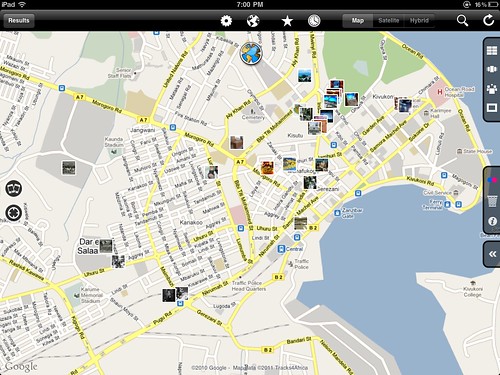
The fact is, this app is not a new concept but a fantastic implementation. Panoramio is a great website to go to and they actually have an iPhone app, but the fact that they DON'T have an iPad app tells you that it is much more about user contributions than searching the database. While the ability to contribute is great, my focus is the window on the world version 3.0.
This app adds the flickr library to geo searches. Its fluid, responsive, and not very buggy. They really tried to Apple-up the concept and even have cover flow functionality to look through selected pictures. While many have tried, no one, including this app has been able to really replicate the cover flow motion of the iPhone.
Being able to search the globe, and this quite literally is the ENTIRE globe, for pictures from other geo explorers is something that gets me excited about the next version of my Window on the World, whatever it may be.