Monday, November 29, 2010

Gone for a Walk to the Supermarket

I was pretty disappointed after downloading the Esri ArcGIS app for the iPad a while back. It didn't seem to offer much of anything. Quite honestly, I haven't opened the app prior to today in a couple months. My big complaint was that the available maps or layers were arranged haphazardly and not easy to surf. Perhaps just by luck, when I searched for popular maps today I came across a layer showing walkable access to fresh food.

This is a topic that interests me personally but also has applications in my job. We've completed a similar analysis but the maps we created look comical compared to this one.

Walking access to supermarkets

At first it looked extremely detailed and like it took a LOT of work to get all the data but on closer inspection it's not all that complicated.

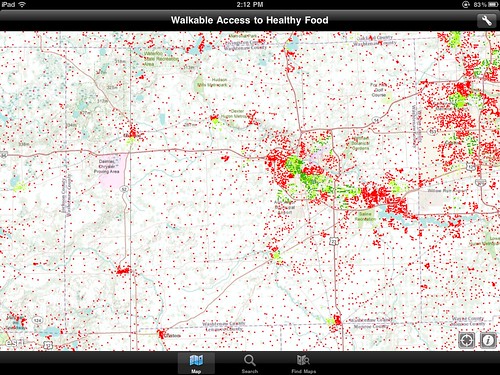
With so many dots it's easy to think that each represents a household. It turns out that the dots actually represent areas. These points are called centroids and contain data for an area or polygon but are displayed as points. In this instance, the centroid represents census blocks. The census is notorious for suppressing all of the interesting information. Also, I don't recall a "can you walk to a supermarket from your house" question on the census form. So we know that none of the data came from the census, only the geography of the blocks, in this case, centroids. Fortunately, a layer of supermarkets is pretty easy to come by. Just like that we can easily account for two-thirds of the equation, census block centroids and the locations of supermarkets. A simple GIS selection will show the census blocks within a mile of a supermarket.

Now it gets tricky, and this is where I've struggled at work. How can you determine if residents of a particular household can walk to a supermarket? You can't. At least not on a large scale, like the entire US, you can't. The biggest factor is whether or not a sidewalk is available but it's impossible to trace a walking path from every house to the nearest supermarket. From a GIS standpoint the easiest layer to add in to this equation is sidewalks. A reasonable corner to cut to estimate walkability is to assume that if a census block has a sidewalk in it, you count it as being walkable. There are lots of exceptions but that is how I would do it.

However, I think this map cuts even more corners. I can tell you that no one has sidewalk data for the entire country...not even Google! It looks like the cartographer has assumed that urban areas, namely cities and villages, all have sidewalks.

So while this map implies amazing detail it is really a huge collection of assumptions and estimations. That's really ok, it gives a great snap shot of "walk access" for an area. The problem is, when you are trying to determine where to fill sidewalk gaps to allow more people walk access to fresh foods, you need to know if they actually have a place to walk, not just whether they live in a city and if there is a sidewalk somewhere near there home.

Still, it's an excellent point of departure for a more detailed analysis and map. I'm definitely a fan of the use of centroids for census blocks.

Kudos to Esri for creating an app that is more than I initially thought. If you have an iPad go get it, it's free!

Monday, November 22, 2010

A Thanksgiving Tradition and a Map to Boot

One of the things that I find relaxing about the holidays is a standard routine. Knowing where and when the family will get together and that I have four days of leftovers coming my way is a great feeling. Even the fact that no matter what happens, the four-day thanksgiving weekend will seem shorter than any other two-day weekend offers an element of comfort along with the frustration it brings.

Despite this desire to do things exactly as they have been done before I am looking for a new tradition to add to the holiday routine. I think I've found one in the Fifth Third (that's the sponsor not numeric description) Detroit Turkey Trot, a 10 kilometer run that starts at the Spirit of Detroit statue in the heart of the city.

I've found that in addition to being a great way to stay in shape and relieve stress, running is also a great way to see an area. Whether it's gaining a new perspective on a place you see frequently or a way to see a new place as you travel, running is a great way to witness the world.

While I've spent lots of time in the City of Detroit I'm looking forward to seeing and experiencing it in a new way, all while starting a new tradition to bolster my routine.

Ive included two pictures below, the first is an image of the Spirit of Detroit as seen in Google Earth, the second is the 10k race route.

Happy running and enjoy that tryptophan.

Spirit of Detroit

2010 detroit turkey trot course map

Friday, November 19, 2010

Little Black Dots on the Other Side of the World

Photo 1 - 2010-11-19
As a kid I was amazed by the multitude of cities and places found on maps or globes.  I wondered what Madagascar looked like and what the people who lived in Novosibirsk were like.  After seeing pictures of a place like Angel Falls on TV, I would go find it on a map and be intrigued that something so mammoth and enigmatic could be displayed by a tiny symbol.  Maps are filled with tiny black dots, each representing a city.   Those dots also represent the stories, history, and experiences of the people who live there.  Thinking of the millions of stories behind each tiny black dot on a map makes the world seem like an endless wonder of culture and geography.

Eventually for me, pictures and stories were not enough, and I found it was time for an adventure to one of these far-away places.  I wanted to have a better understanding of how life was different in one of those little black dots on the other side of the world and needed to go there to really experience it.

My curiosity led me to rural Tanzania, which seemed as far away – both physically and culturally – as I could get. With help from Global Volunteers, I was teamed up with a private school in rural Tanzania in the Village of Pommern, about two hours south of Iringa.  

While there, my assignment at the school entailed teaching computers and geography.  In preparation, I developed some basic lesson plans and even pulled a few things out of my old Computer Science book for class.  When I finally made it to the school after 17 hours worth of flying and nine hours of driving, I realized I was going to have to throw my lesson plans out the window and start from scratch.  

Growing up in a time and place where the computer has emerged as an indispensable tool, I didn’t expect the type of challenges I faced in Tanzania.  The West is a place where electronic technology is ubiquitous.  Even those who aren’t computer-savvy have been exposed to technology and used something like a telephone or a remote control.  This isn’t the case with most people in Tanzania.  We spent several full class periods working on the computer double-click – not the concept, the action.  The mouse was something so foreign that the children didn’t know what to make of it, or how to click it. Edward, my favorite teacher (pictured with me below), reminded me that repetition was key.  Thus rather than working on file management or word processing, I sat with each student and held their hand on the mouse and we double clicked for hours until they developed some muscle memory for the double-click.
Picture 307

For the geography class, in addition to discussing topographic maps required by a national examination – yes, they even teach to the test in rural Tanzania – I wanted to discuss map distortions, a difficult but critical concept in understanding how we display a three-dimensional earth on a two-dimensional map. Trying to be as resourceful as I could, I used an old soccer ball I found, still smelling of the cow dung it had rolled through the day before on the soccer field. I used the soccer ball to help me illustrate map distortions by stretching the paper around the ball, showing how the paper itself became folded and distorted.  I then highlighted these areas of distortion by rubbing pencil graphite on the folds. As I straightened out the piece of paper, I looked around the room and could tell that at least the concept was beginning to click with them.  

While teaching presented unexpected challenges, it made me realize that these types of challenges were exactly the experiences I was seeking to help me develop a deeper understanding of the world.  Now, what appears to be just another small black dot on a world map to others has real meaning to me.  Behind that black dot is a story and an experience much larger than its symbol. Each time I look at the giant world map hung on my wall at home, I get excited looking at these black dots, because I know each represents another great adventure, and this keeps me excited about traveling this wonderful world.

View this post on My Wonderful World
 

Monday, November 15, 2010

Geography Awareness Week or What was Reagan Thinking?

Happy Geography Awareness Week!

If you do any research on Geography Awareness Week you'll quickly discover that it was first observed in 1987 after being signed in to law by President Reagan. What is not so easy to find is additional information on the original Geography Awareness Week legislation. And here is where WorldGeoBlog digs even deeper! The legislation was signed into law by President Reagan on July 24th. On a day that Reagan described as "A kind of hurried & mixed up short day" the President had a staff meeting to talk about the debt ceiling bill, in addition to signing into law Geography Awareness Week with PL 100-78. In his diaries Reagan also discussed difficult decisions on how to handle issues with German Chancellor Helmut Kohl. Later that day the President formally asked Judge Sessions to be Director of the FBI. The life of a President!

Also of note is the fact that this was first introduced on St. Patrick's Day. A day in which we celebrate and study the Irish. ;) I doubt that entered the mind of Bill Bradley, who sponsored the Senate bill.

I've included a complete list of key dates in the approval of the Geography Awareness Week legislation below.

3/17/1987:
Read twice and referred to the Committee on Judiciary.
6/4/1987:
Committee on Judiciary. Ordered to be reported without amendment favorably.
6/4/1987:
Committee on Judiciary. Reported to Senate by Senator Biden without amendment and with a preamble. Without written report.
6/4/1987:
Placed on Senate Legislative Calendar under General Orders. Calendar No. 149.
6/9/1987:
Passed Senate without amendment and with a preamble by Voice Vote.
6/15/1987:
Referred to Subcommittee on Census and Population.
7/14/1987:
Subcommittee on Census and Population Discharged.
6/11/1987:
Message on Senate action sent to the House.
6/11/1987:
Referred to House Committee on Post Office and Civil Service.
7/14/1987:
House Committee on Post Office and Civil Service Discharged by Unanimous Consent.
7/14/1987:
Called up by House by Unanimous Consent.
7/14/1987:
Passed House by Voice Vote.
7/14/1987:
Cleared for White House.
7/15/1987:
Measure Signed in Senate.
7/17/1987:
Presented to President.
7/24/1987:
Signed by President.
7/24/1987:
Became Public Law No: 100-78.


Geographic Travels put together a nice post on the focus for Geography Awareness Week 2010, fresh water.

I should also take this opportunity to announce that WorldGeoBlog will be featured as the blog of the day, on November 19th on National Geographic's mywonderfulworld.org blog. Be sure to check back in on Friday for my featured post.

Also check out the Geography Awareness Week Facebook Page

For more information, Matt Rosenberg put together a great post on the history of GAW earlier this year.

Monday, November 8, 2010

Ailsa Craig's Granite

Yesterday I joined the Detroit Curling Club and I am pumped. I went curling a couple times last year and was quickly hooked. This year I took the initiative to take the required community education class and ultimately participate in a league.

Curling isn't on the radar of many people with the possible exception of the Olympics every four years. Earlier this year we even gained a new verb "Shuster" following a few unfortunate bad shots by the US skip. There were likely more twitter references to Shuster in a week than there have been regarding the entire sport of curling before or since! But for me, curling is now something I'm fortunate enough to play every Sunday.

Curling is a game full of strategy, etiquette and extremely unique tools of the game, the broom and stones. The granite used to make curling stones from only a couple places on earth. A leading supplier of curling stones, the Canadian Curling Company gets its granite from a quarry in Wales, while Kays of Scotland, who has been the exclusive provider of stones for the Olympics, gets their granite from a small island off the Scotland mainland, Ailsa Craig.

Well, tell me something comes exclusively from one place and of course the first thing I do is look that place up!

The image below shows the location of Ailsa Craig relative to the Mainland and relative to the Isle of Islay, which should sound familiar. At only two miles around it's hard to believe that anything on the island is endemic.

ailsa craig

I'm already excited for Sunday!

Monday, November 1, 2010

My Little Plot of Land on the Isle of Islay

I'm a big sucker for creative marketing, especially when it feels as though you are getting something in return. What more tangible thing is there to offer than land ownership? Laphroaig Scotch caught me hook line and sinker when they offered me a lifetime lease on the Isle of Islay, home of the Laphroaig distillery. The fact that I could view the exact location of my plot of land on a map was gravy.

Each new package of Laphroaig comes with instructions on how to claim your lifetime lease. The idea goes, everyone who buys a bottle of Laphroaig is entitled to a square foot of land. All you have to do to claim your spot is to register as a friend of Laphroaig. Of course I know this is volunteering some information, but who cares?!

After I registered I received a certificate with the lease arrangement whereby I can collect "rent" of a dram upon visiting the Islay. A copy of my certificate is below.


laphroaig cert

Pretty cool, I say.

What intrigued me most about his proces was the ability to see my little plot of land. Laphroaig has set up a cool tool which let's you zoom in to the distillery grounds and see your square foot of Islay. Unfortunately it looks like my square foot falls in a bit of a blind spot zone as you can see in the picture below. Look in the lower right corner.

Photo 1 - 2010-11-01

Well, at least I can see ABOUT where it is and when I make it to Islay one day I'll be able to see it, because, don't you see, instructions on how to find your plot are part of the lease agreement too.

Pretty cool indeed!