
How can a country that produces as much oil as any other country be so dependent on others to fulfill its energy lust? By consuming near 19 million barrels per day. Yes "million", and "diem".
I'll now casually evade discussion of current ecogeopolitics by instead focusing on some map commentary.
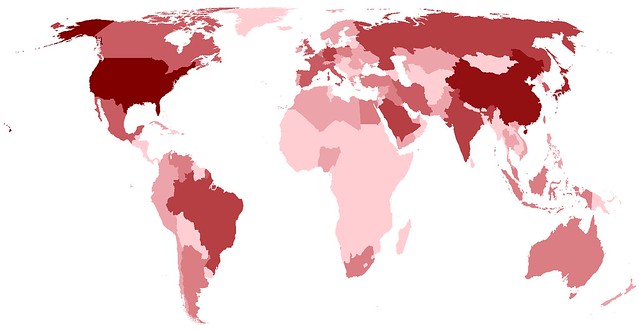
I was pretty pleased with my map last week. The color scheme worked and a quick wiz-bang in Photoshop created one of my better looking nerd project maps. Additionally, I've found I really like world maps that don't color borders. This isn't a "we are the world moment" or have anything to do with "breaking down the walls between us" (a quote from the Olympic opening ceremony song in Seoul, 1988), I just like how they look. For today's map I eliminated borders and instead included data for all countries. I stuck with a reddish theme, the darkest of which shows those countries that consume the most oil per day. I only used...I think it was eight colors, but note (full data on countries consuming more than 100k barrels per day listed below the map) the US uses more than twice as much as the next most glutinous consumer, China.
Remember, clicking on a map will always take you to a larger, higher resolution version.
Here is the list of countries by rank of oil consumption
1 United States 18,690,000
2 European Union 13,630,000
3 China 8,200,000
4 Japan 4,363,000
5 India 2,980,000
6 Russia 2,740,000
7 Brazil 2,460,000
8 Germany 2,437,000
9 Saudi Arabia 2,430,000
10 Korea, South 2,185,000
11 Canada 2,151,000
12 Mexico 2,078,000
13 France 1,875,000
14 Iran 1,809,000
15 United Kingdom 1,669,000
16 Italy 1,537,000
17 Spain 1,482,000
18 Indonesia 1,115,000
19 Australia 946,300
20 Singapore 927,000
21 Netherlands 922,800
22 Taiwan 834,000
23 Venezuela 740,000
24 Iraq 687,000
25 Egypt 683,000
26 Argentina 622,000
27 Belgium 608,200
28 Turkey 579,500
29 South Africa 579,000
30 Poland 545,400
31 Malaysia 536,000
32 United Arab Emirates 435,000
33 Greece 414,400
34 Pakistan 373,000
35 Hong Kong 359,000
36 Thailand 356,000
37 Ukraine 348,000
38 Sweden 328,100
39 Algeria 325,000
40 Kuwait 320,000
41 Vietnam 311,400
42 Philippines 307,200
43 Colombia 288,000
44 Libya 280,000
45 Nigeria 280,000
46 Switzerland 280,000
47 Chile 277,000
48 Portugal 272,200
49 Syria 252,000
50 Austria 247,700
51 Kazakhstan 241,000
52 Israel 231,000
53 Romania 214,000
54 Czech Republic 207,600
55 Finland 206,200
56 Norway 204,100
57 Morocco 187,000
58 Ecuador 181,000
59 Belarus 173,000
60 Cuba 169,000
61 Denmark 166,500
62 Puerto Rico 164,100
63 Ireland 160,900
64 Peru 157,000
65 Yemen 155,000
66 New Zealand 154,100
67 Uzbekistan 145,000
68 Qatar 142,000
69 Hungary 137,300
70 Azerbaijan 136,000
71 Bulgaria 125,000
72 Turkmenistan 120,000
73 Dominican Republic 118,000
74 Jordan 108,000
75 Croatia 106,000


we combined the 2 maps (top 5 of each) a few weeks back when we were studying the ME, and had some interesting discussions.
ReplyDeleteThis is my first time visit to your blog and I am very interested in the articles that you serve. Provide enough knowledge for me. Thank you for sharing useful and don't forget, keep sharing useful info: cbd oil
ReplyDelete