Monday, February 28, 2011

Map of Oil Production by Country and my OPEC Misconception

With all this "Mess O' The Whole Potamia" stuff gong on (not to mention $3.50 per gallon gas) I decided to look up information on oil production by country. While the data was easily accessible (thank you Central Intelligence Agency), I couldn't find a good map showing oil production levels. Since my inquiring mind wanted to know, I put together a monochormatic map showing daily oil production by country for countries that produce at least 100,000 barrels per day.

I'm sure the data on oil production has a lot of caveats that come with it, but I'm not interested in those details. I'm interested in how far off my perception of oil production is from reality.

A few things really jumped out at me. I knew the US produced a lot of oil but had no idea it produced 9 million barrels per day. I've always thought OPEC were THE big ones. However, that doesn't seem to be the case - or at least to a lesser extent than I thought.

The map of oil production by country is below. I haven't included a legend but I have included the list (ranking) of countries at the bottom of this post. The darker the color the more oil the country produces. I've highlighted the 12 OPEC countries with a gold line and a shadow. In this map, OPEC countries don't appear all that special, just a random group of countries that produce significant amounts of oil.

But gas is still $3.50 a gallon. That's a lot of Ethiopian Birr.
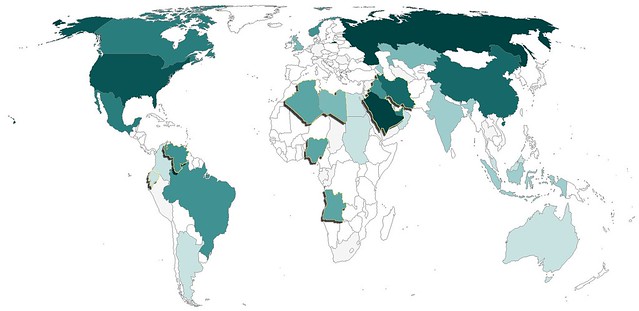
Oil production and OPEC

Oil Production and Rank (2009)
1 Russia 9,932,000
2 Saudi Arabia 9,764,000
3 United States 9,056,000
4 Iran 4,172,000
5 China 3,991,000
6 Canada 3,289,000
7 Mexico 3,001,000
8 United Arab Emirates 2,798,000
9 Brazil 2,572,000
10 Kuwait 2,494,000
11 Venezuela 2,472,000
12 Iraq 2,399,000
13 Norway 2,350,000
14 Nigeria 2,211,000
15 Algeria 2,125,000
16 Angola 1,948,000
17 Libya 1,790,000
18 Kazakhstan 1,540,000
19 United Kingdom 1,502,000
20 Qatar 1,213,000
21 Indonesia 1,023,000
22 Azerbaijan 1,011,000
23 India 878,700
24 Oman 816,000
25 Argentina 796,300
26 Malaysia 693,700
27 Colombia 686,600
28 Egypt 680,500
29 Australia 589,200
30 Sudan 486,700
31 Ecuador 485,700
32 Syria 400,400
33 Equatorial Guinea 346,000
34 Thailand 340,900
35 Vietnam 338,400
36 Yemen 288,400
37 Taiwan 276,800
38 Republic of the Congo 274,400
39 Denmark 262,100
40 Gabon 241,700
41 Turkmenistan 197,700
42 South Africa 191,000
43 Germany 156,800
44 Trinidad and Tobago 151,600
45 Peru 148,000
46 Italy 146,500
47 Brunei 146,000
48 Japan 132,700
49 Romania 117,000
50 Chad 115,000

Monday, February 21, 2011

Bedside Report

Today was supposed to be a relaxing Presidents Day. While I was able to spend some time watching The History Channel's documentary on the Presidents, today, like the last 5 days has been miserable.

I suppose it's that time of year. I always seem to get sick around this time of year for some reason, and mother nature decided to add insult to injury (or illness) by dumping not far off of a foot of snow.

After I spent what seemed like much more than an hour shoveling my car out from the snow I decided to look up a map to visualize areas of the country who have the greatest number of people spending their Presidents Day miserably waiting for good health.

At first, the fact that it was widespread nearly all over the country made me feel a little bit comforted...no, I just feel like crap.

Monday, February 14, 2011

Mapping Readers Around The World

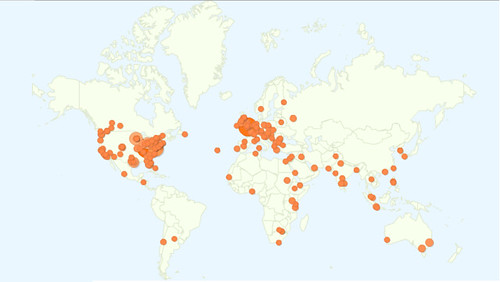
I love maps, I love data and I love blogging. Perhaps the most rewarding part of blogging is when maps and data come together with Google Analytics enabling me to see all the different places from which people access my blog.

Using Google Analytics to track new blog readership starts out very slowly, with a few visits from your own area, probably because you forgot to block your IP address. After a few days and a few posts you might add a couple extra page views, this time it's usually a relative or friend. In time, you might even get someone to subscribe after you send out a tweet with a link to your blog. At some point, your blog becomes well indexed by Google and you start getting readers from all over the world, resulting from all sorts of strange search terms. This is when the blog begins to grow organically, and it is at this point where the readership maps become interesting.

Perhaps due to the world focus of this blog, I've been able to attract readers from all over the world.

I've included a map showing the location of World Geo Blog readers over the last several weeks. I've also added a new page called 'Who reads WGB?" (because I couldn't think of anything clever) up top. I'll be updating that page with various maps and metrics furnished by Google Analytics.

Blog reader map Janfeb2011

Sweet!

Fun fact: This blog is accessed more in London than any other place in the world. That leads me to believe that I have some loyal Londoners (had to Google that demonym) as readers. To be completely honest, with regard to "demonym", I had to use Google to figure out which word I was looking for in the first place. Fun fact number two, you get some unexpected results when you google "what do you call people from a particular place". :)

So, where are YOU? I encourage you to leave a comment and let me know which city or country you are writing from. How's the weather in your neck of the woods?

Monday, February 7, 2011

National Geographic and the Soon-to-be South Sudan

Two weeks ago, my nerd project focused on the dramatic change a divided Sudan will have on world maps. Because National Geographic is the be-all and end-all of quality maps (in my world), I used a snapshot from their iPad app and created a modified map from it to impress upon readers the dramatic change that will result.

When I finished my modified map, I contacted National Geographic to see if the Map Policy Committee had taken any action on South Sudan or if there were any updates as to how National Geographic plans to depict South Sudan. Always helpful, Juan Valdes replied. It turns out, a lot of thought has been given to South Sudan.

"In recognition of Southern Sudan's new political standing, the Society's Map Policy Committee examined how this autonomous region should be portrayed on our maps. As Southern Sudan has yet to gain its independence, and following the Society's principles for recognizing semi-autonomous states, it has been decided that the region should be designated on our maps as an "Area of Special Status." Where scale permits, our maps will show Southern Sudan in a gray boundary band or gray fill. Final color designation will be discussed and determined when Southern Sudan nears its independence. Juba, the region's administrative center, will be identified by a special symbol.

Additionally, and where scale permits, the Sudanese region of Abyei will be recognized. Although its borders were left undefined in a 2005 peace deal, in July 2009 the Abyei Tribunal redrew this region's borders. The redrawn borders left most, but not all, of the region's Muslim population residing outside its boundaries, making it more likely that the majority of its population would vote to join the south. This region will, for now, be identified by a simple red boundary treatment and the use of the following note: 2009 Abyei Tribunal Decision Line."

Unforunately, still no Map Policy Committee meeting minutes, although I did send another email to Cindy Beidel about those...I'm not going to get my hopes up. NGS seem relatively tight lipped about things before they are made official, one once they are made official it's re-established that its officiality is based in policy. That sounds circular, I think it's rather clever.

I look forward to an update of the National Geographic World Map. As of today, neither the Executive or Political World or Continent maps have been updated on their iPad application.

It turns out National Geographic has a policy for modified maps, too. Apparently Mr. Valdes has taken a peak or two at my blog and asked that I include the following:

Map modified by Ryan Buck. Boundaries and names shown do not necessarily reflect the map policy of the National Geographic Society.

I, of course, instantly added the disclaimer and think National Geographic has taken a remarkably understanding course of action with my modified map. The fact that there was concern (and I use that term loosely) over confusion the map might cause, probably overstates my photoshop abilities. If nothing else, I got a shout out on Matt Rosenberg's (about.com) twitter account.

Monday, January 31, 2011

Africa in an Instant

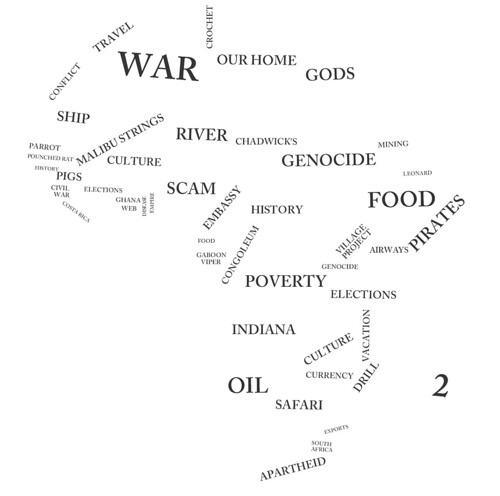
Inspired by the Very Small Array map, the United States of Autocorrect, I set out to create a similar map for other locations in the world using Google Instant Search.

Naturally, I started with Africa.

After eliminating the insipid instant results, something even better began to materialize. The continent took shape as a collection of history, strife and misconception - but in words. The words appeared powerful and descriptive enough on their own that I decided to remove the borders. What resulted surprised me, a map I call Africa in an Instant.

Africa in an Instant

Click on the image above for the original large, high quality image.

Pretty cool!

Monday, January 24, 2011

Nerd Project: Political Map of South Sudan

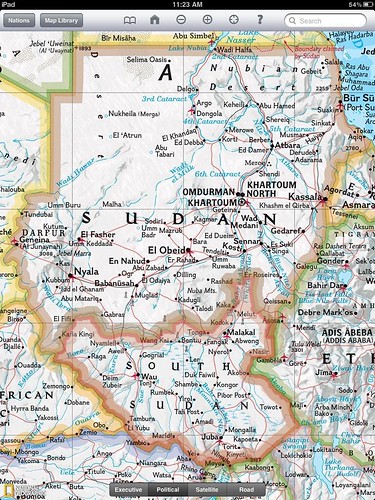
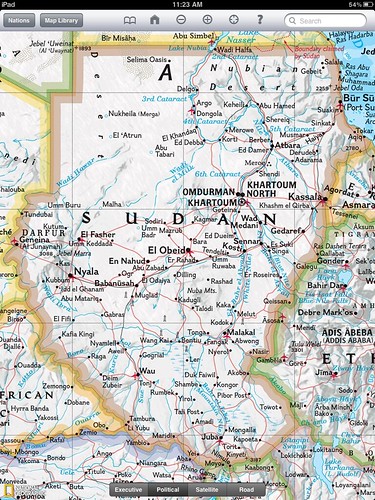
There are a number of issues that still need to be resolved to fulfill the Comprehensive Peace Agreement, but the people have called for an independent South Sudan. To help visualize this dramatic change in geography and cartography I've created an... Improvised Political Map or IPM.

A couple weeks ago, I wrote that this would be the most noticeable change on the world map since the breakup of the Soviet Union. The IPM below clearly shows that to be the case.

South Sudan Nat Geo iPad copy

The folks at National Geographic asked that I prevent any confusion by including the following:

Map modified by Ryan Buck. Boundaries and names shown do not necessarily reflect the map policy of the National Geographic Society.

The CPA requires that the details of the independence referendum be worked out by July 9 of this year. National Geographic won't be out with a map showing South Sudan until well after the details have been worked out but hopefully this improvisation will hold us Sudan map and geography hobbyists until then! I have emailed Juan Valdes from National Geographic Maps to get some "industry gossip" (if there is such a thing) on portraying South Sudan. I'll let you know what I hear.

I employed some fairly "rudimentary" tools to do this. It's not perfect but it serves its purpose - to show us how different Sudan will look on a political map. The map is an edited copy of a screenshot from the National Geographic iPad app. In case my map has fooled you, National Geographic currently shows Sudan as below.

Saved Photos-114

Perhaps the greatest challenge was picking a color. South Sudan will border six different countries, Sudan, Central African Republic, DRC, Uganda, Kenya and Ethiopia. National Geographic only uses six colors on their political maps which means I couldn't create a South Sudan border without copying another color. You might notice I sort of blended the border color with Kenya. That's fitting given the Ilemi Triangle issue.

I was having a hard time figuring out how National Geographic would color seven countries with six colors. It wasn't until a conversation at work that I realized the issue was my inability to change the color of the bordering countries which was the actual limiting factor. Fast fact - a Google search following that realization taught me (haha... "a Google search taught me") China borders more countries than any other.

I think it's time to email my old South Sudanese penpal Rengo Gyyw Rengo Jr!

It turns out Google is on the move to update and create maps of South Sudan

If you liked this post don't forget to check out other nerd projects.