Showing posts with label maps. Show all posts

Monday, May 16, 2011

Creativity Springs In Late Sunlight

I think because I don't spend evenings in the late spring and summer sulking in frustration over the limited daylight, this is the time of year when I feel most creative and when I get excited about possibilities. 

Recently, I've been thinking more and more about the original map-meets-web idea, which, for lack of a better idea I called "terraarte".  The idea is simple.  Make maps art.

The first road block came when I realized I am not an artist.

But I worked on it. 

I familiaraized myself with many of the tools I would need and scoured the WWW for images I could use.  I began to do mockups.  The first was this image of Angola.  Despite some issues, I was happy that it "looked cool".


The next hiccup was getting an iPad which allowed me to ignore the fact that my home computer functionally croaked.  As much as I rave about the device, it's not great for creating things such as, well, map art.

Soon I'll be remedying the latter of the two issues which unfortunately is probably the lesser of two weevils.

But some map art, combined with a swing at photography and historical integration is on its way.

And this Thursday I am Scotland bound!

Monday, February 14, 2011

Mapping Readers Around The World

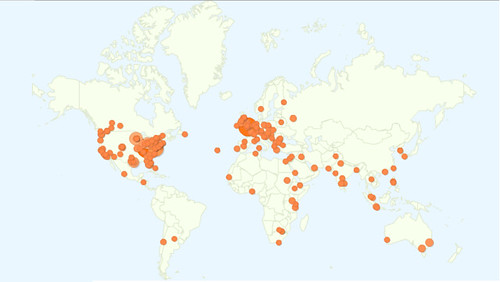
I love maps, I love data and I love blogging. Perhaps the most rewarding part of blogging is when maps and data come together with Google Analytics enabling me to see all the different places from which people access my blog.

Using Google Analytics to track new blog readership starts out very slowly, with a few visits from your own area, probably because you forgot to block your IP address. After a few days and a few posts you might add a couple extra page views, this time it's usually a relative or friend. In time, you might even get someone to subscribe after you send out a tweet with a link to your blog. At some point, your blog becomes well indexed by Google and you start getting readers from all over the world, resulting from all sorts of strange search terms. This is when the blog begins to grow organically, and it is at this point where the readership maps become interesting.

Perhaps due to the world focus of this blog, I've been able to attract readers from all over the world.

I've included a map showing the location of World Geo Blog readers over the last several weeks. I've also added a new page called 'Who reads WGB?" (because I couldn't think of anything clever) up top. I'll be updating that page with various maps and metrics furnished by Google Analytics.

Blog reader map Janfeb2011

Sweet!

Fun fact: This blog is accessed more in London than any other place in the world. That leads me to believe that I have some loyal Londoners (had to Google that demonym) as readers. To be completely honest, with regard to "demonym", I had to use Google to figure out which word I was looking for in the first place. Fun fact number two, you get some unexpected results when you google "what do you call people from a particular place". :)

So, where are YOU? I encourage you to leave a comment and let me know which city or country you are writing from. How's the weather in your neck of the woods?

Tuesday, August 31, 2010

National Geographic Responds

In the process of writing a post questioning National Geographic Map Policy I was given the name of the Director of Editorial and Research for National Geographic Maps. I emailed him with a few questions on current map policy, specifically related to the Hala'ib triangle, Bir Tawil and Somaliland.

Today I heard back from Juan. As promised, his email is below. It's nothing groundbreaking and if I'm honest, predictable, but it speaks to the map giant's ability to respond to the public. I don't totally buy the fact that the scale of the maps prevents them from displaying Somaliland in grey, then again I only buy large maps and so my view might be a bit skewed. There doesn't seem to be any problem displaying Andorra and it is about the size of a pinhead on my 110" wide world map.

Thanks go out to Juan Valdes and Kevin Lance!

Ryan:

Thank you for your email of August 25, 2010 regarding the National Geographic's portrayal of the Hala'ib Triangle, Bir Tawil trapezoid, and Somaliland in our maps.

The Society’s cartographic policy is one of portraying de facto situations; that is, to portray to the best of our judgment the reality on the ground. We consult with multiple authoritative sources on a frequent basis to determine the current political status of disputed territories and how to best represent them in our maps.

With regard to our cartographic treatment of the Hala'ib Triangle, after several military clashes between Egyptian and Sudanese forces in the 1990's, Sudan ultimately withdrew from this area in January 2000. Their forces were pulled south of the political boundary set by the Anglo-Egyptian Agreement of 1899 - the 22nd parallel. Since then, Egypt has effectively administered the area.

As for the Bir Tawil trapezoid, Egypt does not recognize sovereignty over this area on its maps; here, it claims the 22nd parallel as both its political and administrative boundary. Inversely, Sudan officially recognizes the boundary of Bir Tawil as that set by the British in 1902. However, Sudanese sources contradict this stance by cartographically portraying the Bir Tawil trapezoid as being partially administered by the states of River Nile and Red Sea.

To date, the political and military situation in the Hala'ib Triangle remains unchanged, while Egypt's and Sudan's stance on Bir Tawil has been somewhat cartographically defined. Therefore, the Society's Map Policy Committee has recognized Egypt's de facto administration of the Hala'ib Triangle and Sudan's de facto governance of the Bir Tawil trapezoid. As a point of reference, and where scale permits, the 1902 administrative boundary is delineated in our maps accompanied by a label identifying Sudan's existing claim to the Hala'ib Triangle.

Regarding the color fill treatment of Somaliland in our Africa Wall Map, most political boundaries depicted in our maps and Atlases are stable and uncontested. Those that are disputed receive a special treatment. Depending on the map's scale, such territories or separatist states are shown in a gray fill with their administrative centers depicted by an open bull's eye symbol.
Where scale permits, explanatory notes are added to explain the current political situation of such disputed territories.The difference you have noted between our treatment of Somaliland in our World map to that of our Africa wall map is a reflection of this policy.


Finally, yes, I have been a long standing member of the Society's Map Policy Committee.


Your interest in National Geographic maps is appreciated. Thank you for taking the time to write.


Juan José Valdés
Director of Editorial and Research
National Geographic Maps

Wednesday, August 18, 2010

Changing the Looking Glass: Radical Geography

Shape! Size! Distance!

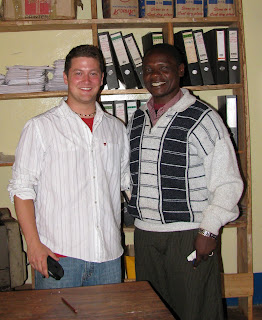
The form 3 students in the tiny village of Pommern, Tanzania outside of Iringa repeated the mantra over and over. Edward, my favorite teacher (pictured with me below right) at the school reminded me that repetition was key to drilling anything new into the kids' heads.

Their exclamation was in response to my question. What are the main types of map distortions?!

Shape! Size! Distance!

Before the class started I found a scuffed up old soccer ball, still smelling of the cow dung it had rolled through the day before on the soccer field- excuse me-pitch!

I've always felt the best demonstration of map distortion was to use a ball and a piece of paper. I folded the paper around the ball to show how the page itself became distorted then highlighted those areas by rubbing pencil lead on the folds.

I straightened the paper to show the distortions when the sphere is projected in two dimensions. Some of the students understood but map projections can be one of the most difficult spatial issues to grasp; But it is paramount to understanding ones place and relative placement on the earth.
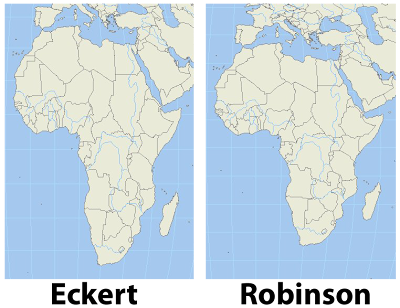
I remember as a child certain world maps making Africa look tall and skinny. Something didn't sit right with me when I saw that particular projection. It turns out that projection was an equal area projection like the Eckert IV shown in contrast with a Robinson projection in the image, left. The Robinson projection is easy on the eyes and just feels right.

Wouldn't you agree?

After a heads up from Matt Rosenberg in his post on the about.com site, I found a great website which uses radical map projections to view data in a new and exciting way.

Projections help us display the spheroid earth on a two dimensional surface. My favorite projection for world maps and the one used by the greats at national geographic is the Winkel tripel projection, a variation on the Robinson projection.

In one post ten projections are layered on each other to show the variations.

Since I mentioned National Geographic I'm excited to tell you that I have received an initial response from the company regarding my inquiries to the map policy committee as well as the Hala'ib triangle. I'll be sure to update you on what I ultimately discover.

I really hope you check out some of the amazing maps at radicalgeography.com.

Monday, July 26, 2010

Google Adds to Virgin Experience with Maps

Most international air carriers offer digital maps as one of the view options with seat back television screens. Google announced last week that a partnership with Virgin America will up the digital map ante by using upgraded terrain based Google Earth maps in their fleet .

I find digital maps on planes to be enjoyable and they actually help me pass the time on long flights. My first experience was on a USA 3000 flight to Jamaica in 2004. The ability to track, in real time, the plane's location was pretty cool. It also beat the heck out of the in-flight movie, Fat Albert.

A Delta flight from Detroit to London in 2009 was my first experience with an interactive flight map. I could zoom in and out as well as toggle between the flight track and flight data such as speed, distance traveled and time remaining until landing. Being able to track the plane's progress made the flight not only seem faster, but more enjoyable as I would think to myself things like "You are directly over the mid-atlantic ridge."

Most recently I flew about 15000 miles with South African Airlines. While they had seat back maps, which most international fleets now do, they weren't interactive. In fact, the map would rotate to another screen of some doofus telling me to do calf raises and toe raises about every 15 seconds. It was a tease. I certainly don't want to get deep vein thrombosis but I don't need to be reminded constantly when stuck on a plane for, during one stint, more than 18 hours. I longed for the ability to zoom in and out at the press of a button and to tell myself things like "You are entering Liberian airspace". Virgin America passengers will no longer have to endure the pain of substandard seat back maps. It's just too bad I don't live near a Virgin America hub.

Since I brought up South African Airlines, I would be remiss if I didn't show you the safety video. Anyone who flies SAA will remember this little guy.


Thursday, June 10, 2010

The Geography Blog

Apparently my love of maps is not shared by many. Niche shops and niche bloggers are out there but with few exceptions one cannot mention their affinity for maps without a look of confusion trickling across the face of the listener.

Maps represent tangible places and experiences. When I was a kid I would look for simple geographic features, like the curving of a coastline or the bending of a road and try to find that feature on a map. I thought about the technology and thought that must go into map making and how refined maps had become compared to their mid-millennium counterparts. I was also a strange kid :)

Now I spend a good portion of my life making maps. For the most part they are simple with a narrow and somewhat boring purpose but I'm hoping to change that. Geography, maps and imagery is my true passion. It's a way to make sense and capture moments in an ever changing and beautiful landscape.

Geography lets us keep our physical place on this planet and in the universe in perspective. It allows us to relate to each other in a multitude of geospatial and cultural ways. It makes us human.

On this blog, I'll run the gamut from google earth to maps, general geography and did you knows, how to's and new technology. I hope you enjoy it as much as I like experiencing it!

Let's get started!